List of Windows 365 Cloud PC Reports in Intune
In this article, we will take a look at the list of Windows 365 Cloud PC reports in Intune. Using the Cloud PC reports, you can review the performance and metric issues of individual Cloud PCs.
Windows 365 currently offers two reports for Cloud PCs: Cloud PCs with connection quality issues and Cloud PCs with low utilization. Both these reports are very useful in determining the performance and metrics of individual Cloud PCs.
According to Microsoft, the Cloud PC utilization report helps you make sure that your licenses are assigned to active users. By reviewing cloud PCs with low usage, you can decide if a Windows 365 license would better serve other users who might use these resources more often.
Windows 365 resource performance helps you get the most out of your organization’s vCPU and RAM resources. You can look at your current score for resource performance and see how it compares to the baseline you chose. Using the tips and suggestions in the Cloud PC reports, administrators can learn how to improve the resource performance score. These reports can also be useful while troubleshooting Cloud PC connectivity issues.
Table of Contents
Locate Windows 365 Cloud PC Reports in Intune
To find the Windows 365 Cloud PC reports in the Intune portal, follow these steps.
- Sign in to Microsoft Intune Admin Center.
- Select Devices > Overview > Cloud PC Performance.
- Here you see the list of all the Windows 365 Cloud PC reports.
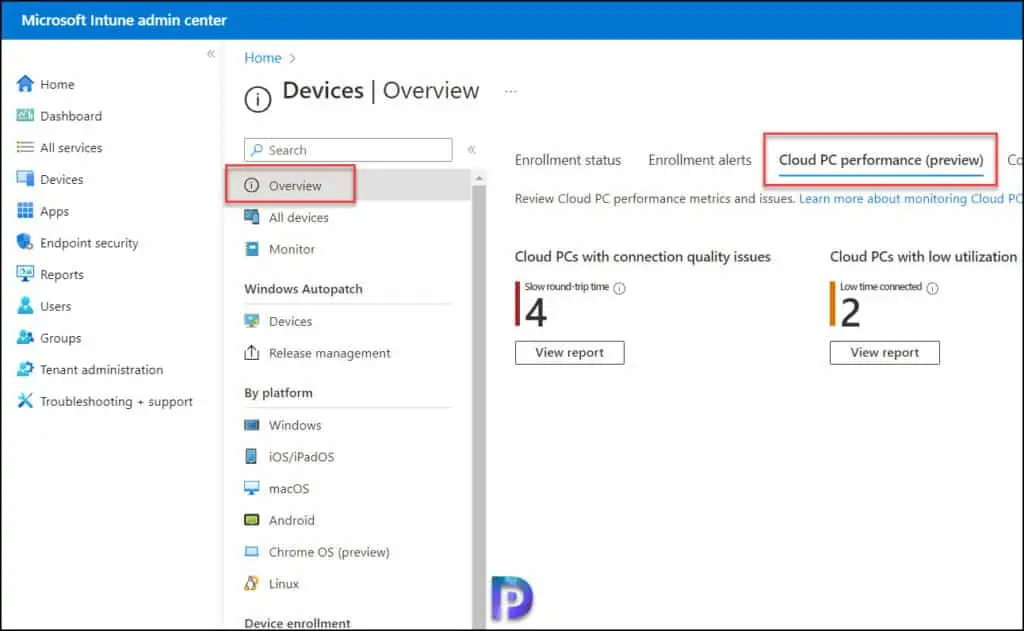
In the Cloud PC performance tab, there are two distinct reports that will help you review Cloud PC performance metrics and issues.
- Cloud PCs with connection quality issues: This report helps you evaluate your users’ connection experiences on their Cloud PCs.
- Cloud PCs with low utilization: The Cloud PC utilization report helps you make sure that your licenses are assigned to active users.
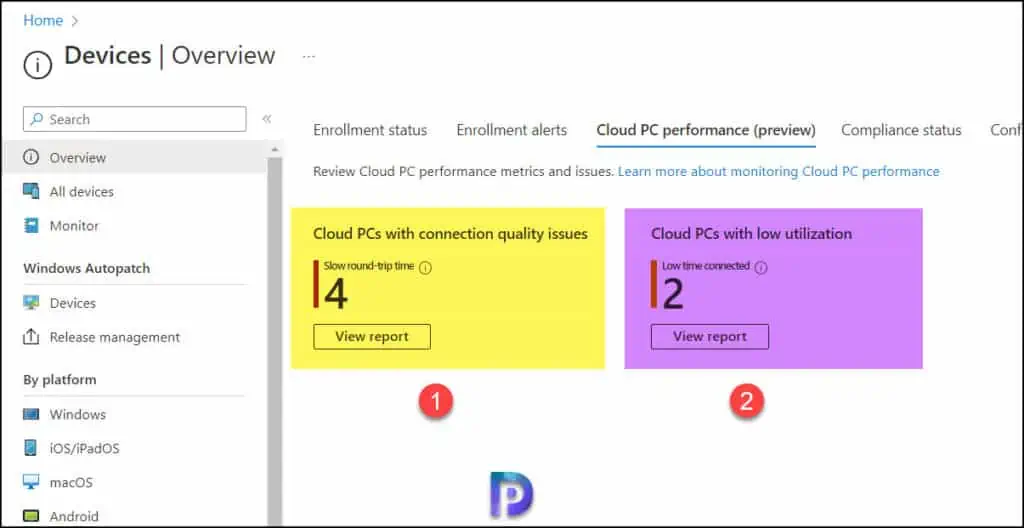
Using the Cloud PC reports, you can look at how each Cloud PC is doing in terms of performance and metrics. We’ll run each of the above described reports separately to understand the insights about Cloud PCs.
Use Cloud PC Connection Quality Report
The Cloud PC connection quality report helps you evaluate your users’ connection experiences on their Cloud PCs. In other words, with this report, you can review the speed and quality of connection for your Cloud PCs.
To get to the Cloud PC connection quality report, sign in to Microsoft Intune admin center, select Devices > Cloud PC performance > View report (under Cloud PCs with connection quality issues).
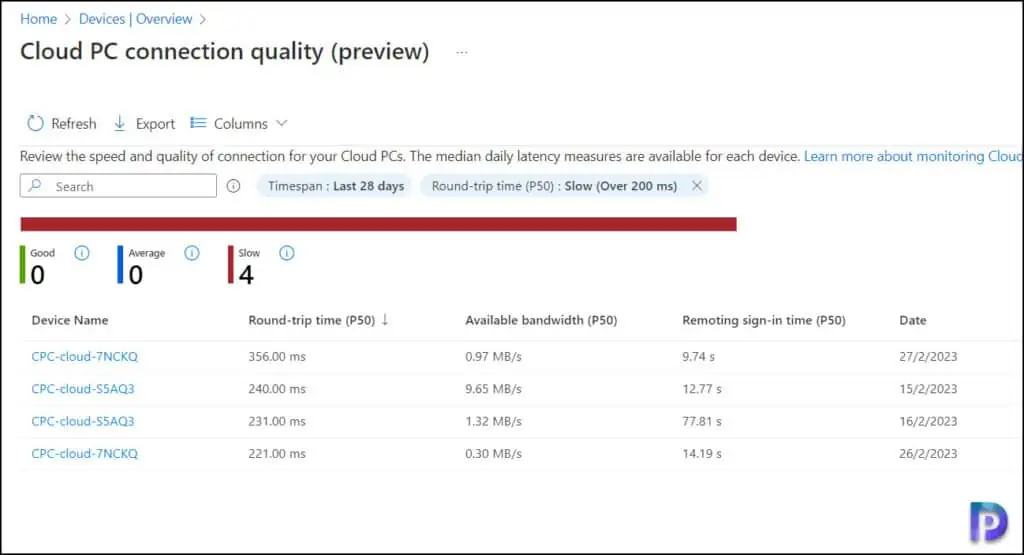
When you run the connection quality report for Cloud PC, it shows the following details:
- Device Name: The actual Cloud PC name.
- Round-trip Time (P50) (ms): The number of milliseconds it took to establish the user connection to the Cloud PC. Lower values indicate better round-trip connectivity.
- Available Bandwidth (P50) (MB/s): Internet bandwidth during the user’s attempt to connect to their Cloud PC.
- Remoting sign-in time (P50) (seconds): The number of seconds it took the user to complete the sign-in process.
- Date
The histogram shows aggregated round-trip times of all the Cloud PCs in your tenant. Each metric is aggregated to a P50 median level over the last 24 hours. The round-trip time is how many milliseconds it took to connect to the Cloud PC.
- Good: Less than 100 milliseconds.
- Average: 100-200 milliseconds.
- High: More than 200 milliseconds.
At any given point, you can use the filter to see only data for a specific usage group. For example, you can select Add filter and modify the Time span and round trip time options. You can use the Export option to export all connection quality data of Cloud PCs in this view to a comma-separated values(.csv) file.
Use the Cloud PC utilization report
The Cloud PC utilization report helps you make sure that your licenses are assigned to active users. By reviewing Cloud PCs with low usage, you can decide if a Windows 365 license would better serve other users who might use these resources more often.
To run the Cloud PC utilization report, sign in to Microsoft Intune admin center, select Devices > Cloud PC performance > View report (under Cloud PCs with low utilization).
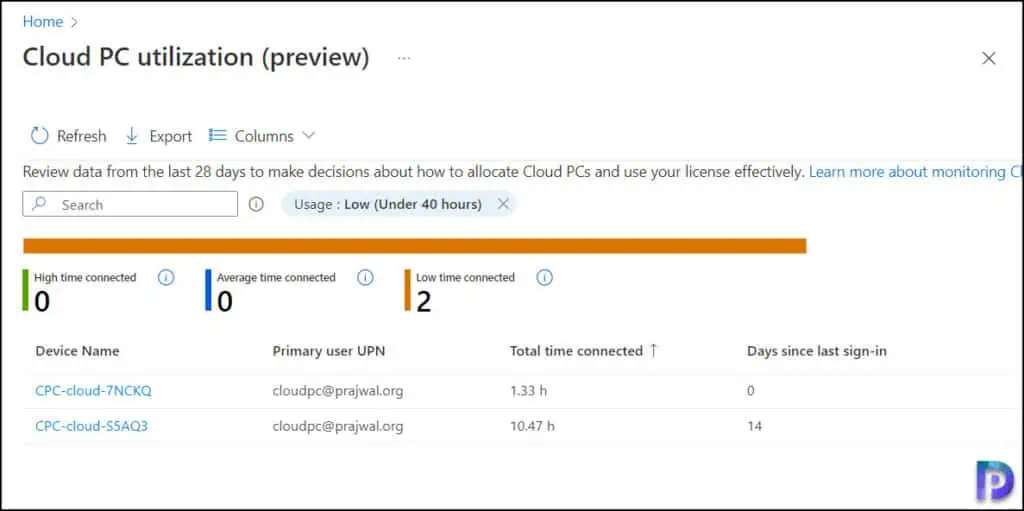
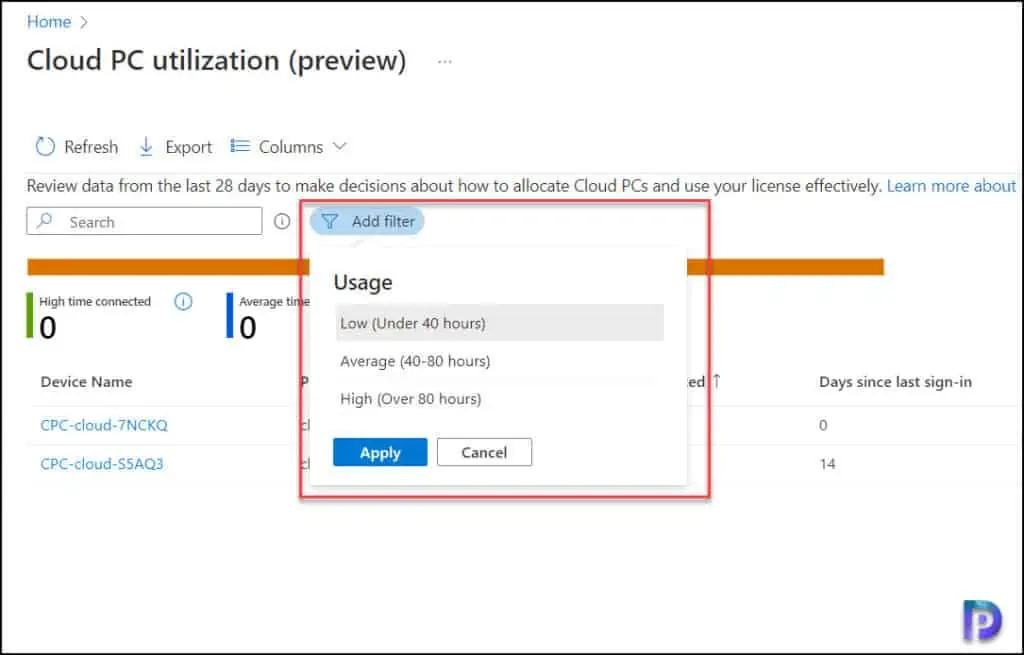
In the report output, we see the following data aggregated for the last 28 days. This histogram shows user connection time in three sections:
- High Time connected: More than 80 hours.
- Average time connected: 40-80 hours.
- Low time connected: Less than 40 hours.
- List of individual Cloud PCs with the following columns:
- Device name: The Cloud PC name.
- Primary user UPN: The UPN of the user account that accessed the Cloud PC.
- Total time connected: The total hours that the user has been connected to the Cloud PC over the last 28 days.
- Days since last sign in: Time in days since the user signed in to the Cloud PC.
At any given point, you can use the filter to see only data for a specific usage group. For example, you can select Add filter and choose the usage options such as Low, Average, or High.
View Resource Performance Report for Cloud PCs
Windows 365 resource performance helps optimize vCPU and RAM resources on the devices in your organization. To get to the Resource performance report, sign in to Microsoft Intune admin center, select Reports > Endpoint analytics > Resource performance.
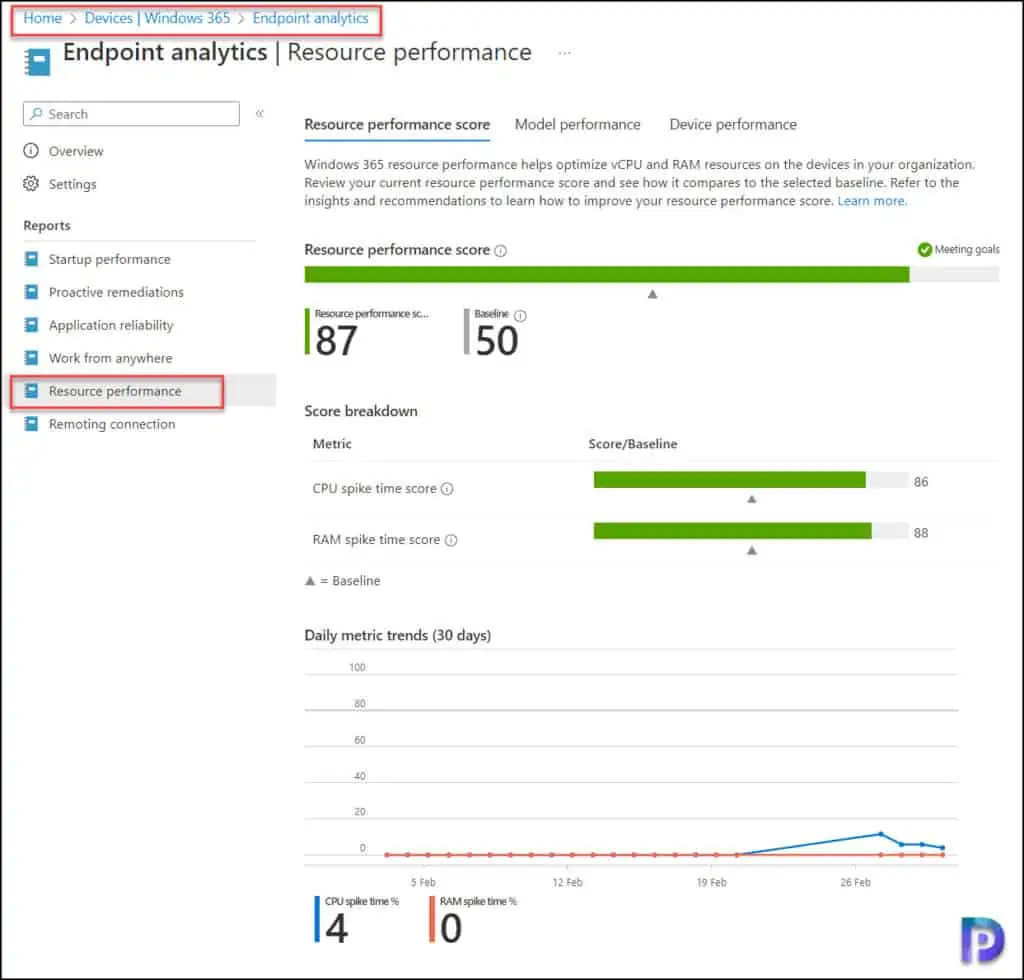
The Windows 365 resource performance includes four tabs of information:
- Resource performance score
- Model performance
- Device performance
Resource Performance Score Report
The resource performance score shows the weighted average of the CPU spike time and RAM spike time scores for all the devices in your organization. Sign in to the Microsoft Intune admin center and go to Reports > Endpoint Analytics > Resource performance to see the resource performance report.
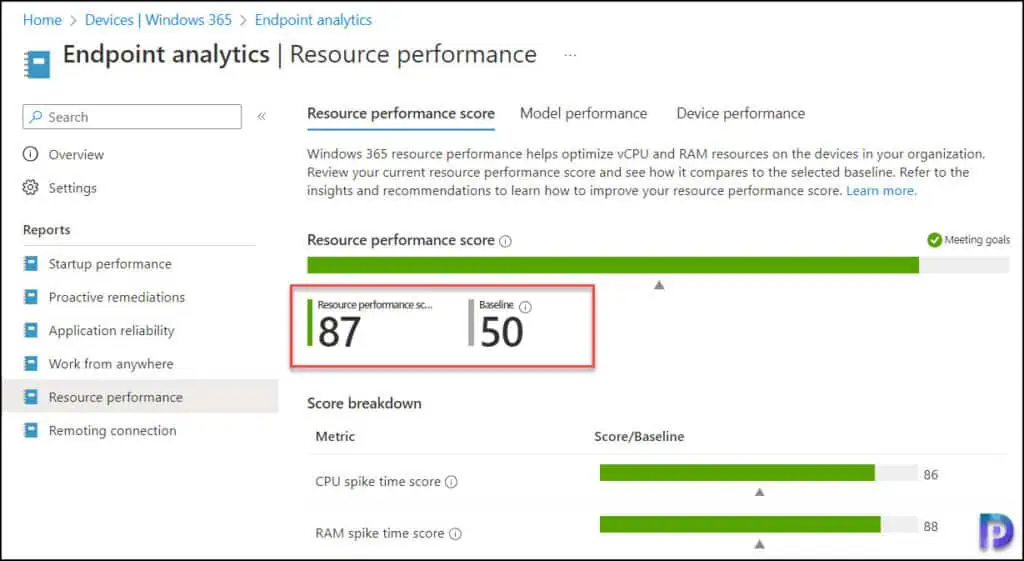
- CPU spike time score: Displays the total usage time and percentage of CPU spike time of all the devices in the organization and scores of each device from 0 (poor) to 100 (exceptional). The daily metric trends graph plots the ratio of CPU spike times to total usage time. This CPU spike % data is averaged over a 14-day period ending on the date at the bottom of the graph. Usage over 50% is considered a spike.
- RAM Spike time score: Displays the total usage time and percentage of RAM spike time of all the devices in the organization and scores of each device from 0 (poor) to 100 (exceptional). The daily metric trends graph plots the ratio of RAM spike times to total usage time. This RAM spike % data is averaged over a 14-day period ending on the date at the bottom of the graph. Usage over 50% is considered a spike.
Along with CPU and RAM Spike time scores, there is also baseline and Insights and recommendations. The insights are provided by Microsoft in order to improve the score of your devices. If the devices are already at a good score, you may not find any new insights. Baseline helps you see if you’re meeting goals. You can set the baseline to the organizational median or a custom value.
Model Performance Report for Cloud PCs
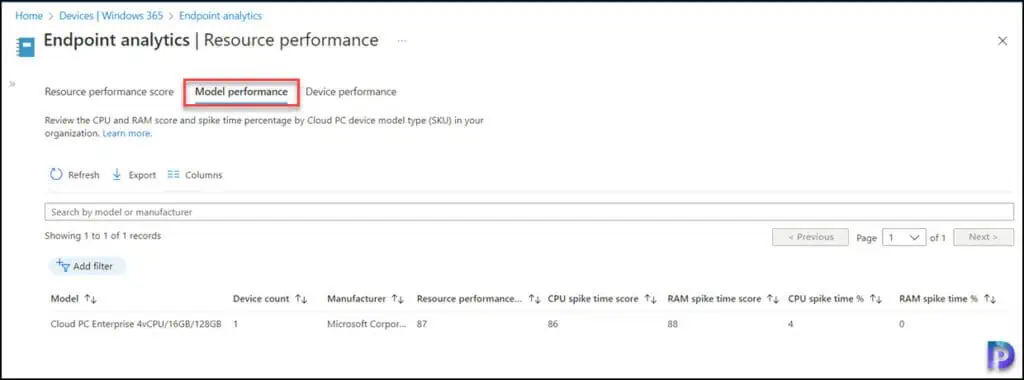
The model performance tab report shows the CPU spike time and RAM spike time scores and percentages for each of your Windows 365 Cloud PCs model SKU in your Intune tenant.
The following details are presented on the Model performance tab of Resource performance report.
- Model
- Device count
- Manufacturer
- Resource performance score
- CPU Spike time score
- RAM spike time score
- CPU spike time %
- RAM spike time %
Cloud PC Device Performance Report
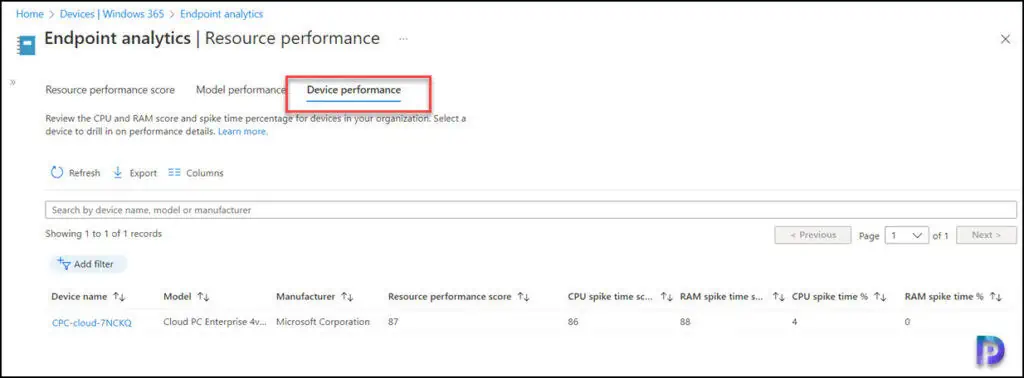
The device performance tab shows the CPU spike time and RAM spike time scores and percentages by for each Cloud PC device in your organization.
Remoting Connection Report in Endpoint Analytics
Among all the Windows 365 Cloud PC reports, the Remoting connection report in Endpoint analytics is important and useful. This report allows you to monitor key performance metrics for connecting to the Cloud PCs. You can review key performance metrics for connecting to your Cloud PCs and how it impacts user connectivity.
There are two metrics in the Remoting connection tab:
- Round trip time (ms): Ratings are categorized as Good(0-100ms), Average(100-200ms), and Poor (above 200ms).
- Sign in time (sec): Ratings are categorized as Good(0-30 seconds), Average(30-60 seconds), and Poor (above 60 seconds).
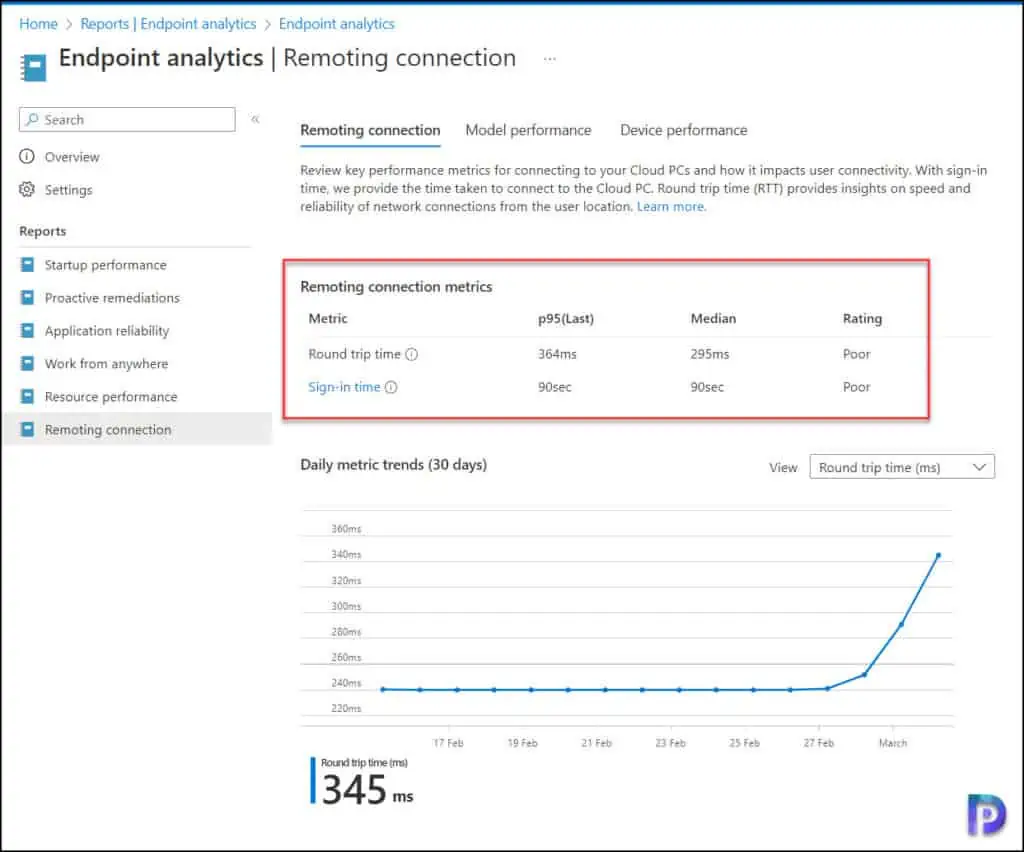
Similarly, the Model performance tab and Device performance tab of Remoting connection report shows the Cloud PC performance metrics.
Conclusion
The Windows 365 Cloud PC reports are useful in analyzing the performance and metric issues of individual Cloud PCs. When you have many Cloud PCs, monitoring the performance and connectivity issues can be a challenging task. The Cloud PC reports will definitely make the tasks of admins much easier.
