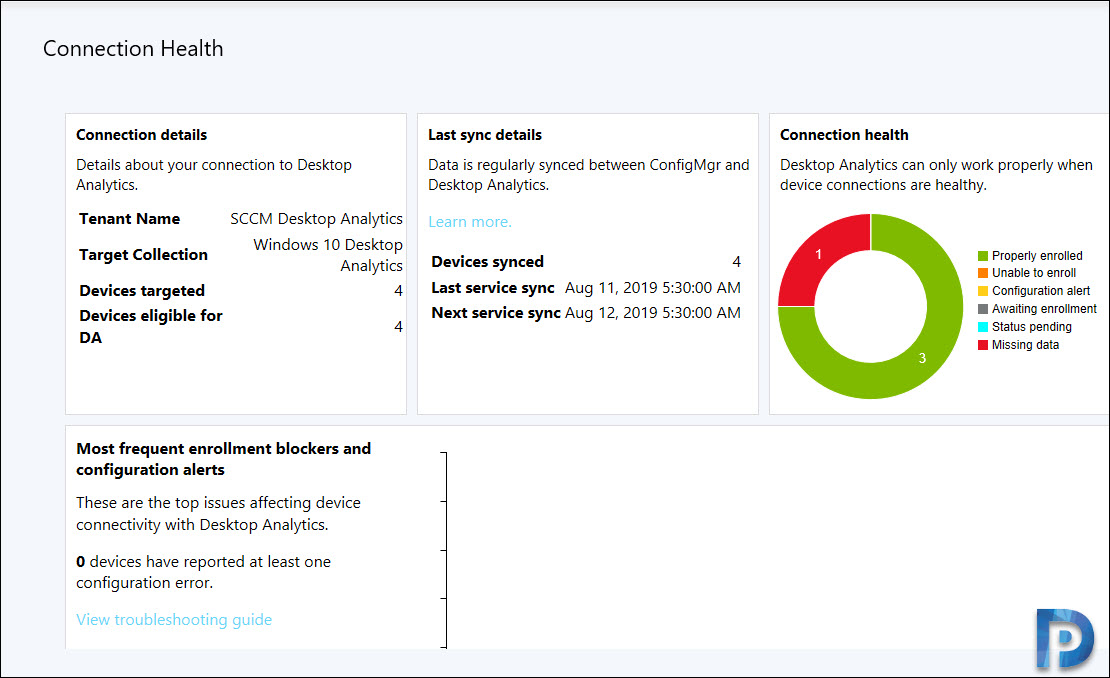
Desktop Analytics Connection Health Dashboard
After you setup Desktop Analytics and connect with SCCM, you can use the Connection Health dashboard in Configuration Manager to monitor device health. In this post I will cover everything about the connection health dashboard.
In my previous post I covered the steps to setup desktop analytics. I also covered the steps to connect Configuration Manager to Desktop Analytics. I would recommend you read these post before you proceed further.
When you first set up Desktop Analytics, you have to wait before you start using it. It can take around 2-3 days for active devices to send diagnostic data to the Desktop Analytics service. The service will process the data, and then synchronize with your Configuration Manager site.
Hence when you look at the connection health node, the charts may not show complete data for few days. There is nothing you can do in the Desktop Analytics portal as well. However the dashboard is important when you want to troubleshoot or monitor the device health.
Table of Contents
Desktop Analytics Connection Health Dashboard
To locate Connection Health dashboard after you set up Desktop Analytics.
- Launch Configuration Manager console.
- Go to the Software Library workspace.
- Expand the Desktop Analytics Servicing node.
- Click the Connection Health dashboard.

Connection Details
This tile shows the information about the connection from Configuration Manager to Desktop Analytics. This is the same data that you configured while connecting ConfigMgr to Desktop Analytics.
- Tenant Name – This is the name of DA connection in the Azure portal.
- Target Collection – This is the same device collection that you specified in Azure Services wizard to on-board to Desktop Analytics. When you specify a device collection, the Configuration Manager configures with your commercial ID and diagnostic data settings.
- Device Targeted – The devices that are part of target collection excluding the ones that are obsolete, inactive or unmanaged.
- Devices eligible for DA – These are the devices that are eligible for Desktop Analytics. Check the desktop analytics prerequisite which are covered here.
Last Sync Details
After you connect Configuration Manager with Desktop Analytics, the data synchronization occurs frequently. The last sync details tile shows the the following details.
- Devices synced – Count of devices synced between Configuration Manager and Desktop Analytics.
- Last service sync – The Last updated time in the Desktop Analytics portal.
- Next service sync – The next sync schedule between SCCM and Desktop Analytics.
Desktop Analytics Connection Health
The most important section of this dashboard is the connection health. The health chart displays the number of devices with the health states.
- Properly enrolled – The device appears in Desktop Analytics with a complete inventory
- Unable to enroll – There’s a blocking issue that prevents device enrollment
- Configuration alert – You should see configuration alert in two cases. Either the device doesn’t appear in Desktop Analytics or appears with an incomplete inventory.
- Awaiting enrollment – Configuration Manager has configured the device, but it doesn’t yet appear in Desktop Analytics.
- Status pending – This means the SCCM is still configuring this device. You must wait if you see this status.
- Missing data – If you see the any device with state missing data, it means that Configuration Manager configured the device correctly, but Desktop Analytics only has partial data.
If you click any of the health state tile, for example “Properly Enrolled”, that should list all the devices that are properly enrolled with DA.
You should see the device status with following information.
- Commercial ID Configuration.
- Minimum compatibility update.
- Windows diagnostic & commercial data opt-in.
- Windows diagnostic endpoint connectivity.

